Chris Papalia
Teaching High School Statistics
Chris Papalia
Education Background
- B.A. Physics - Macalester College, 2007
- B.Ed. Mathematics and Physics - University of Toronto/OISE, 2009
- M.Ed. Curriculum, Teaching, Learning - University of Toronto/OISE, 2018
Professional Background
- Durham District School Board 2009 – 2012
- St. Andrew’s College 2012 – Present
Professional Interests
- Teaching Statistics
- Data Science and Analytics in R
- Tech Integration into Teaching & Learning
- Coaching Hockey, Baseball, and Squash
Focus
This is a "show and tell" to describe what I've done to develop a better stats experience in high school and explore some of the next steps for high school statistics.
I hope something about this talk can resonate with you and puts into perspective what you see from your students

1. My Context at SAC
2. Sharing what I do
3. The Future of High School Statistics?
My Context
Statistics at St. Andrew's College
Grade 12 - MDM4U: Mathematics of Data Management
- Three sections, n ~ 15
Grade 12 - AP - Statistics
- Two sections, n ~ 15
~ 60% of senior students
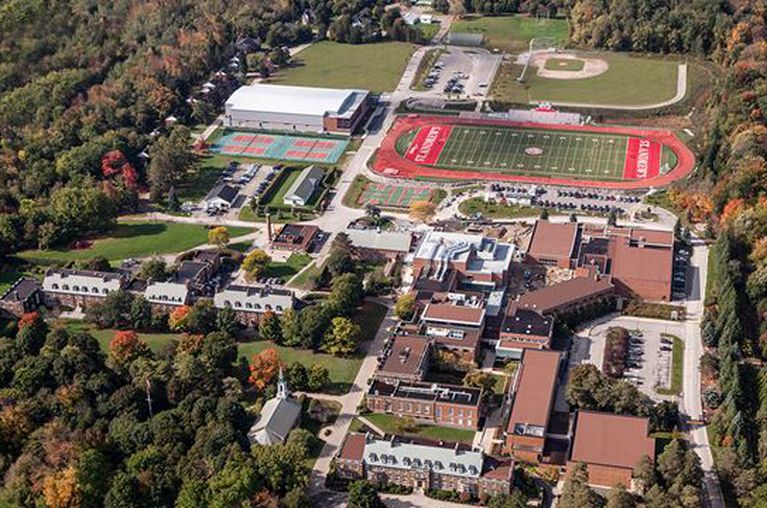
Since my colleague and I arrived in 2012 the program has grown considerably - picked up an extra section of AP Stats and full sections of MDM
Units of Study: MDM4U
One-Variable Data (categorical/numerical)
Individuals, Z-Scores, Comparing Individuals
Two Variable Data - Stacked/dodged bar plots and scatter plots
Study and Experimental Design Principles
Probability and Counting (Independence, Conditional)
Probability Distributions (binomial, geometric, discrete random variables)
Project/Investigation - Using RStudio (hopefully); Data Visualizations
Big Ideas: See Data. Ask Questions. Try to find answers.
Lots of emphasis on using software like Excel and Fathom to:
- explore data
- simulate outcomes
- visualize data
Most of the data we look at is already in "nice, tidy, rectangles" that I provide to students
There is emphasis on projects that are meaningful to students where student find data they're interested in using.
This is their opportunity to use the software tools we have access to.. Excel, Fathom, R and finding data in several sources.
An interesting conflict is we really get to see the gap in reproducibility and data cleaning/tidying and the frustrations in using software like excel with dates, times, and then getting the data to a point where it's usable.
Story of spending one hour trying to automate something that would take you 10 minutes... trade-off when student see this as a one-off. Especially with folks who are doing simulations etc.
Units of Study: AP-Stats
Exploring One-Variable Data
Exploring Two-Variable Data
Collecting Data
Probability, Random Variables, and Probability Distributions
Sampling Distributions
Inference for Categorical Data
Inference for Numerical Data
Inference with Chi-Squares
Inference with Linear Regression
Big Ideas: See Data. Ask Questions. Try to find answers. Prepare for Exam
The bulk of the year is spent working towards AP Exam preparation -> fewer projects
The end of the year project conflicts with their other AP - Exams -> optional investigation
For those who are in the AP - Capstone, I am their "capstone advisor" and encourage them to use RStudio for their analysis.
- {patentr} for analysis on video game patents
- {tidytext} for analysis on Drake's lyrics
- Excel for others... pivot tables; grouping; reproducibility is really a problem I've discovered.
Caden - manually entering pdf data with characters when he has access to the csv.
Ben and Marshall vs Caden and Paul... Sample code and comments on a test file vs videos and screen clips and file structure changes. It's old-hat for you folks, but it was a huge moment for me to truly understand the value of reproducibility. Similarly, the students really "got it" when I suggested doing it on a small file and then apply the code to other features.
In both classes I try to use R coding to explore data before I give it to them to look at and ask questions about... This is particularly useful in the one and two-variable
Day-to-day...
75-minute periods (every other day - full year)
Textbook: OpenIntro Stats Reading and Example Problems
AP Free-Response Problems and OpenIntro Problems during class and homework
Data analysis projects to apply their learning to data of their choice
Data, Simulations, Spreadsheets as often as possible
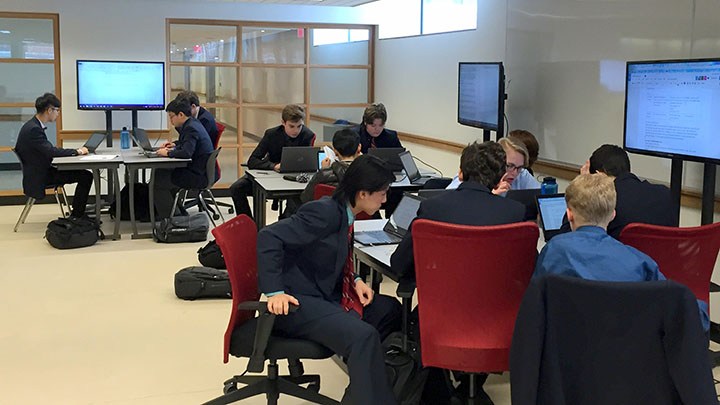
Themes: sports, nhl-reference, mlbstatcast, kaggle imdb, tidytuesday, statcan Videos of me entering data into excel and then filtering it into other sheets and looking using pivot tables.
Sharing what I do
Me teaching stats 12 years ago
Calculations by hand
TI 84 was a luxury
Reserve a computer lab once/month

Journey...2009 - 2019
Part I - Unit Restructure
Part II - Software
Part III - Confidence
#Rstats
R for Data Science
Dr. Mine Çetinkaya-Rundel (DS in a Box)
RStudio Community (Webinars and more)
Tidy Tuesday
Arts + Program at SAC

Learning Activities
1. Everything is framed in describing one-variable statistics shape, centre, spread (foundation of the course)
2. Emphasis on working with data to illustrate concepts
3. Refer to AP Exam questions and scoring guidlines
4. Project Prep - Interpret (don't report) the statistics and visualizations
Everything is framed by describing one-variable statistics
We try to use simulations and visualizations with every topic
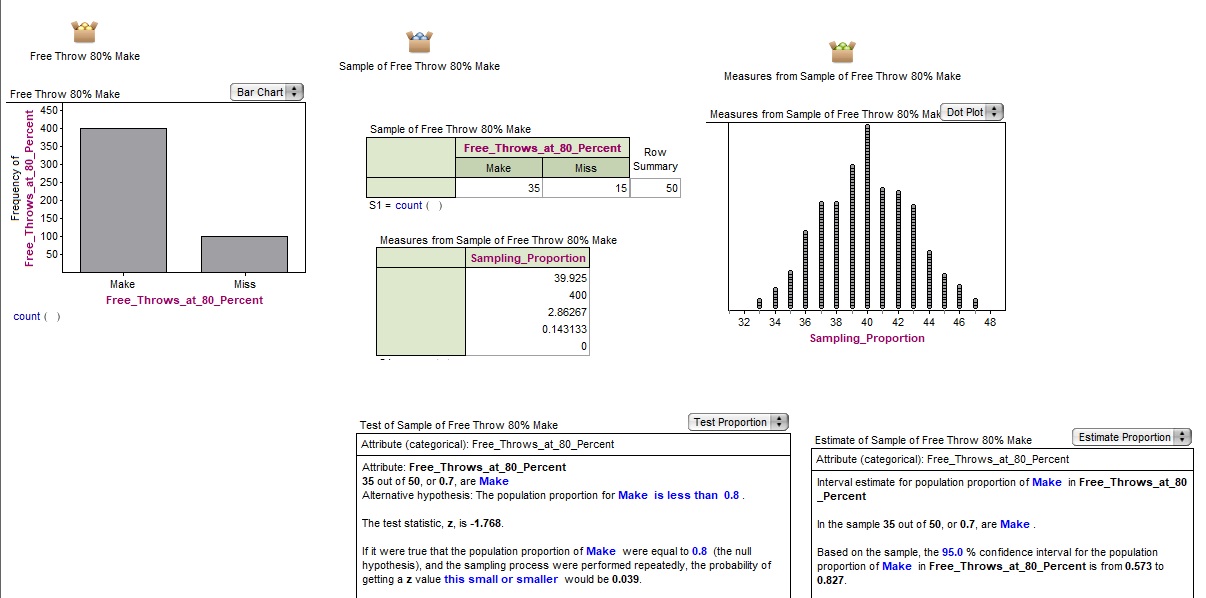
This is the software called Fathom
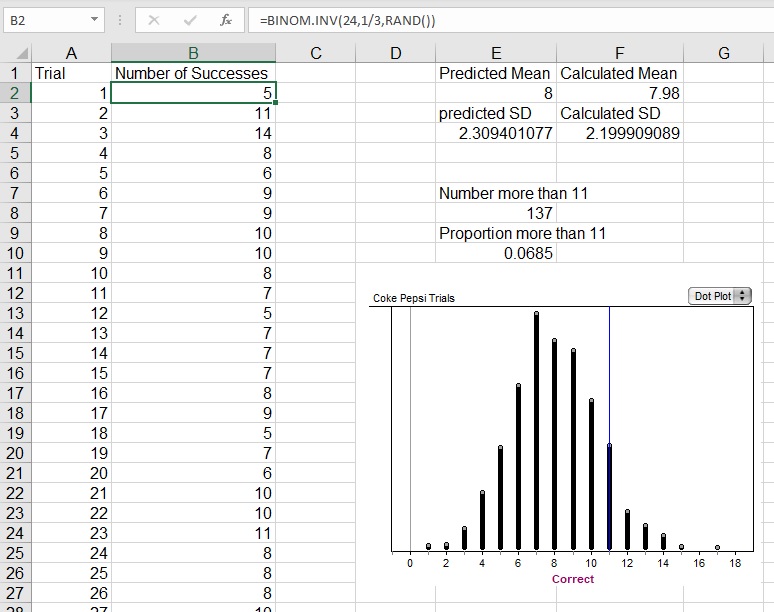
This is a beginning to simulation-based inference in the experimental design unit
Emphasis on data and applets to illustrate concepts
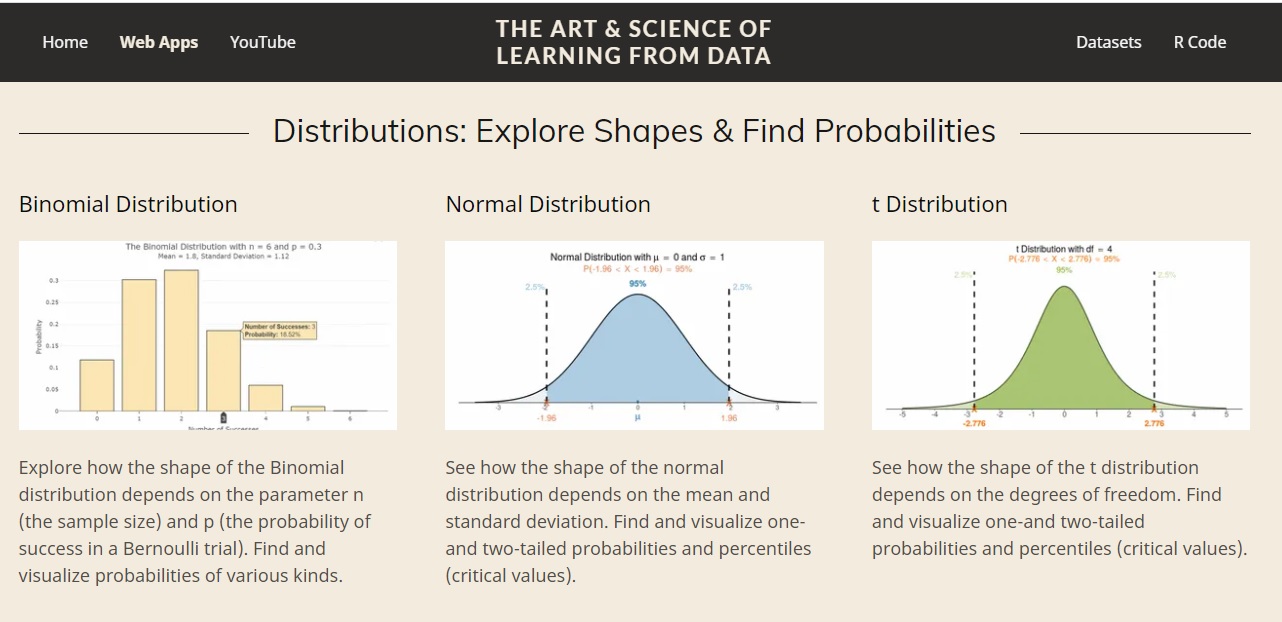
Art of Stat - Web Apps
{palmerpenguins}, {gapminder}, {mpg}, collect our own, sampling, skewthescript.org
Applets: Art of Stats - Web Applets, Kristoffer Magnusson - Visualzations
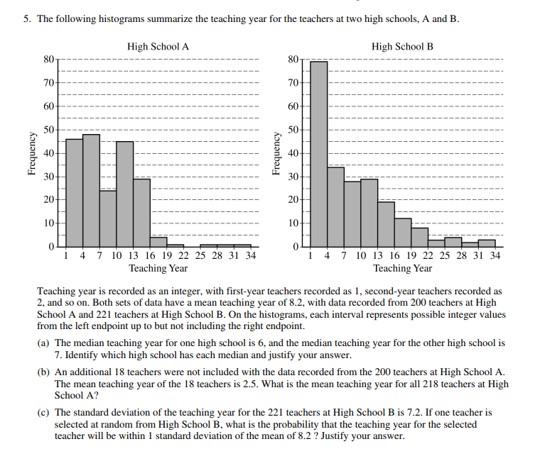
Refer to AP Exam questions and scoring guidlines
MS Teams Collaboration Space/Shared Space/Board
Group work, presentations, and grading rubrics
Pass the problem, create the statistics/data
- This page offers all of the previous AP Free-Response Questions and Solution Rubrics
More Information - My talk from OAME May 2017/May 2019
The Future?
Gaps
1. Ontario's curricular focus/elective course
2. Calculus remains the "Crystal Palace" in math
3. No coherent computing background
MDM4U lives in the intersection of folks who dislike math, and folks who are interested for a "good grade"
Admissions officers differentiate based on calculus
Teachers lack the knowledge-base to support a scaled statistics course
- Software remains limited for teachers/students/AP programs and so there is very limited ability for students to look at an examine models, regression, and prediction.
On-boarding with the RStudio Cloud program was great but then it's been monetized Teaching teachers to trouble-shoot basic problems is a mess...
The Future - Data Science in High School?
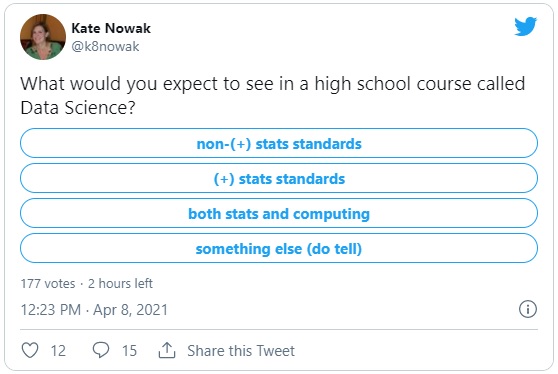
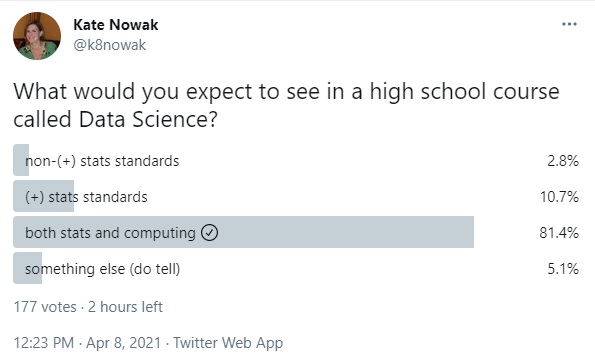
Some Social Justice Data - skew the script Some sports data - Michael Lopez Five Thirty Eight Tidy Tuesday
Data Science/Statistics in High School looks like this...
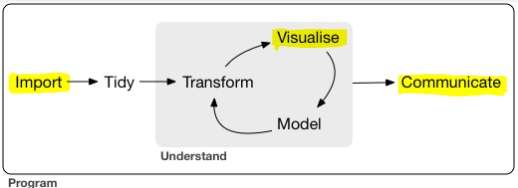
Tidy, Transform, and Model require technical skills that most students don't have...
Strategies
(Good and Bad)
Live Coding EDA
I explore the data and discuss questions and answers with the class
David Robinson Screencasts
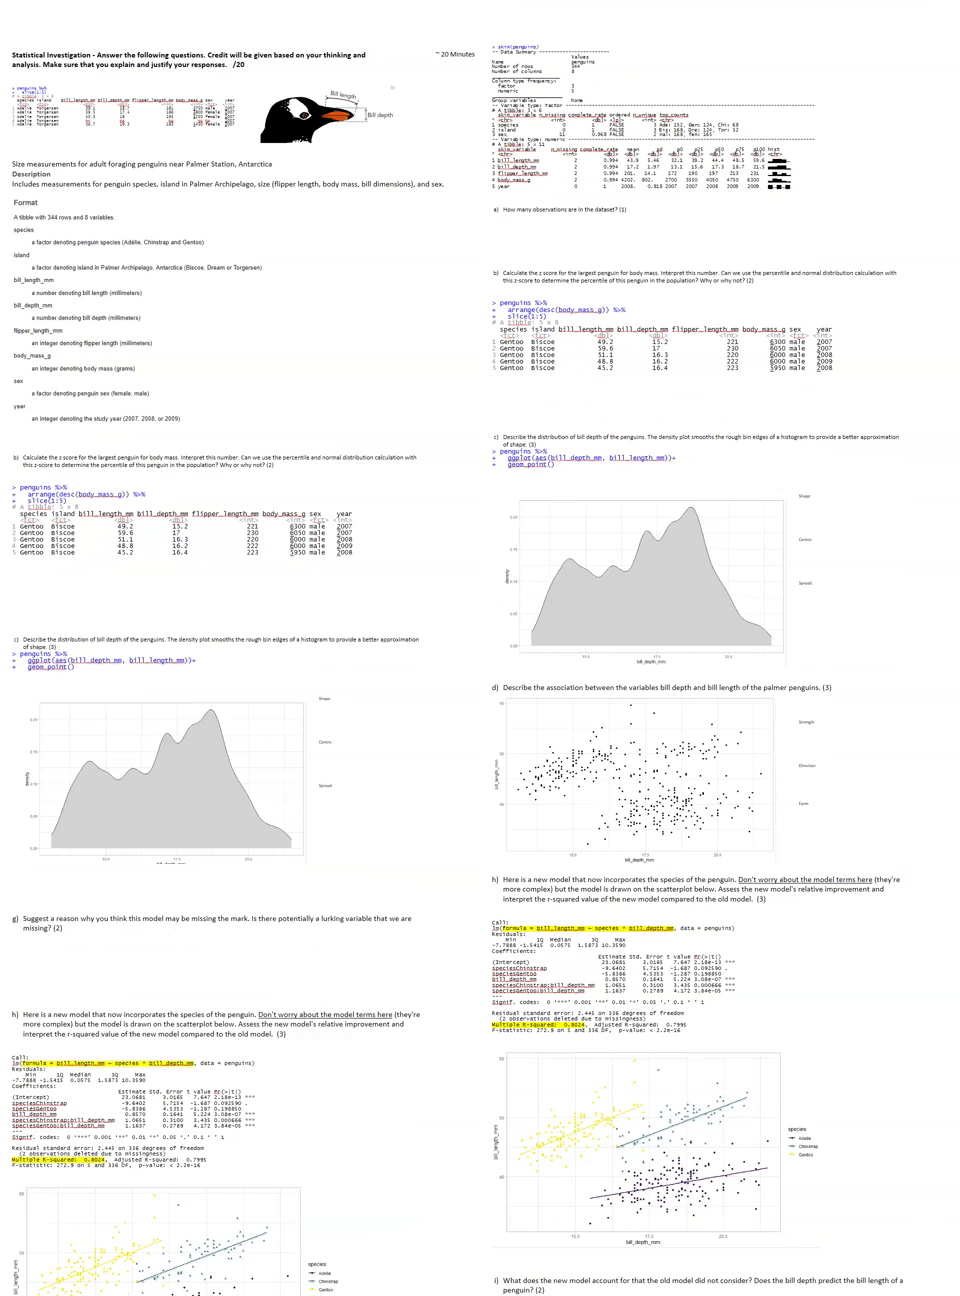
Students and I try to ask questions and find answers within the data
I include this process on a test and have them "explore" it
Jumping Into OpenIntro Labs
Last year I used RStudio Cloud to have students work through the labs associated with the tidyverse versions of the OpenIntro labs in November/December.

My Experiment This Year...
I will offer several opportunities for students to use RStudio with links to helpful resouces for students to work through data
Rstudio Primers
DoSS Toolkit
Allow Excel as another option

The Future - Projects and Partnerships
Great relationship with our CS department
- We want to collaborate with CS and eventually work towards creating a cohort of students who are using computing (and version control?) to solve problems in several fields.
Finding ways for students to apply statistical analysis and computing through the AP Capstone Program and the R for Data Visualization Club
- Marshall used {patentsview} to extract patents and use tidyverse to model patents over time
- Ben used {tidytext} and references to do sentiment analysis with Drake lyrics
- Select group of student sign-up for the club (See the R Club website from last year)
